Understanding the Research Graph
The nine node types a research run is built from, how the graph grows, and what the budget system is doing.

When you launch a research project, your question does not go to one model and come back as one response. It becomes a graph of typed nodes, each doing a specific job — assembling the brief, planning, searching, gating on coverage, writing sections. The graph is that work made visible, in real time, and it is worth being able to read.
What the nodes are
The graph is built from typed nodes, each doing one job. Which of them appear, and in what shape, depends on the strategy your project is running — a Fact Check and a Deep Research run do not produce the same graph.
Nine types can appear:
Enrichment
Assembles the prompt before any research happens: gathers what you already know from your knowledge palace, resolves scope, and creates the research planner. This is where a project stops being a sentence and becomes a brief.
Plan
Reads the brief and decides how to break it down, producing subtasks. Budget-aware — it knows how many nodes it may create and how deep it may go, and plans accordingly (see the budget system below).
Planners appear at deeper levels too. If a subtopic turns out to need its own decomposition, a new planner does it — which is how the graph grows past the first level.
Search
The workhorse and the leaf. A search node gathers, and it also reasons and validates — analysing what it found, comparing sources, spotting contradictions. These are not separate node types; the analysis happens where the material is.
Strategy
Gates, decisions and fan-outs — the structural machinery a strategy uses to control its own shape. Coverage gates that ask “is this good enough yet”, budget checks, evidence gates, the fan-outs that launch parallel investigation. Not glamorous, and the reason a Deep Research run keeps going until coverage holds up rather than stopping at a fixed node count.
Aggregate
Pulls findings from multiple nodes into a coherent whole, resolving conflicts between sources.
Decision, Outline, Section, Assembly
Report writing is not one node. It is four, and seeing them makes a long report’s progress legible instead of a single bar that sits at 90%:
- Decision — evaluates what the research actually produced and picks the output path. A thin result and a rich one should not be written the same way.
- Outline — expands the chosen shape into sections.
- Section — writes one section. Leaf node, one per section, so they run in parallel.
- Assembly — combines the section outputs into the finished report.
How the graph grows
The graph starts with enrichment and a root planner, and expands outward as nodes create subtasks. The typical flow:
Depth 0 — Planning. The root planner reads your prompt and creates child nodes for each subtask it identifies.
Depth 1 — Searching. Child nodes run, gathering and analysing as they go. If a node’s findings suggest further investigation would pay, it can trigger expansion.
Depth 2+ — Deeper investigation. When a node triggers expansion, a new planner breaks that subtopic into further subtasks. This creates another level of depth. The graph can grow to several levels depending on your research strategy and budget settings.
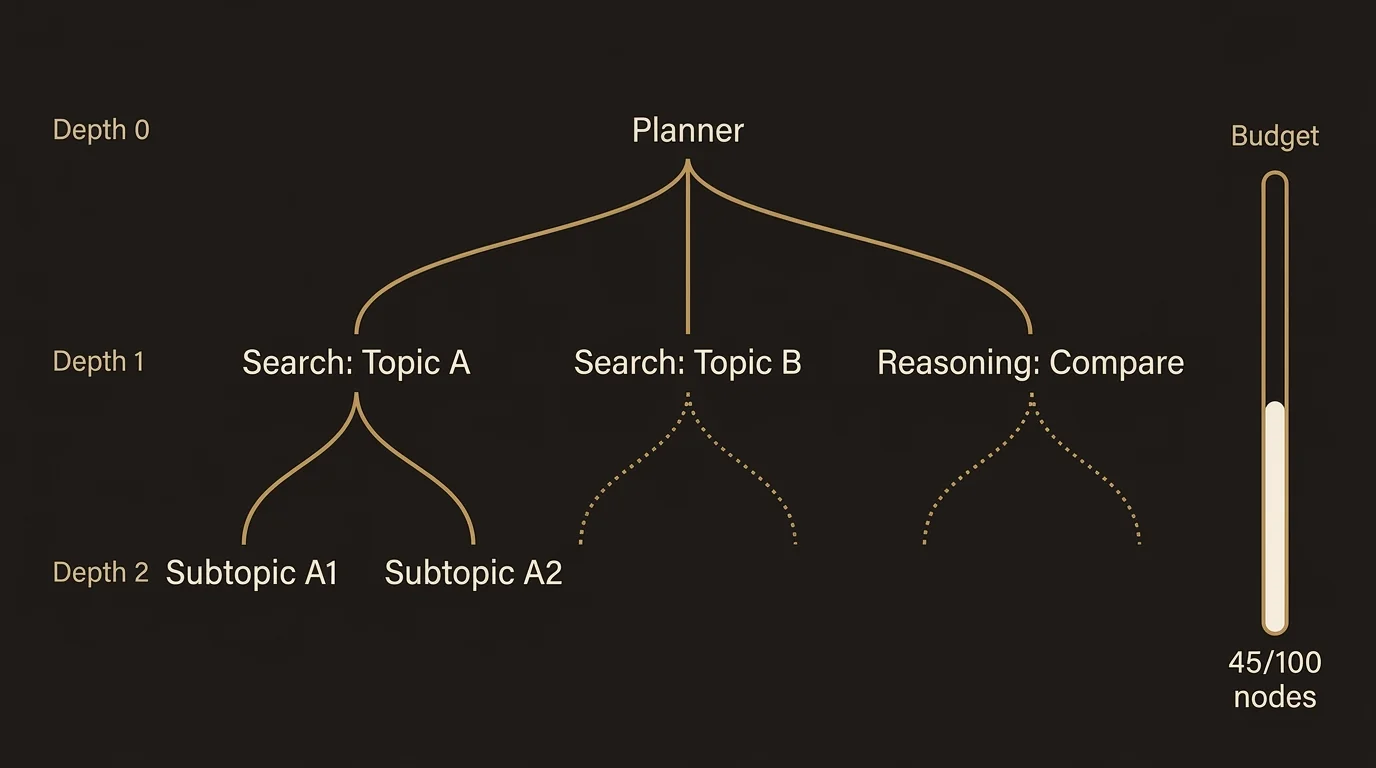
Each level of depth represents progressively more focused investigation. The first level breaks your question into major areas; the second level digs into specific aspects of those areas; a third level might investigate individual claims or data points in detail.
The budget system
Research is not free — each node consumes compute. The budget system keeps a run bounded while still letting it be thorough.
Node budget
The node budget is the total number of nodes your project can create. When a planner breaks your question into subtasks, it draws from this budget. Each subtask that spawns further investigation also draws from it. The budget prevents runaway expansion — without it, a complex question could spawn thousands of nodes.
Budget is distributed hierarchically. When a planner creates four children, it divides its remaining budget among them. Each child can then allocate its share to its own children. This ensures that resources are spread proportionally across the research, not consumed entirely by one subtopic.
Budget tiers
The planner adjusts its behavior based on how much budget remains:
| Tier | Remaining budget | Planner behavior |
|---|---|---|
| Large | 10+ nodes | Creates 3-4 subtasks, some can expand further |
| Moderate | 5-9 nodes | Creates 2-4 subtasks, limited expansion |
| Restricted | 3-4 nodes | Creates 2-3 mostly self-contained subtasks |
| Critical | Under 3 nodes | Creates 2 broad subtasks, no further expansion |
These tiers are automatic — you do not need to manage them.
They only engage past 70% utilization. Below that the planner is given no budget constraint at all and plans on the merits of the question. That is why the advice in Human-in-the-Loop is to start being selective about approvals around the 70% mark: it is the point where the run itself starts economising.
Depth limit
The depth limit caps how many levels deep the graph can grow. A depth limit of 3 means the graph can have a root planner, its children, and one more level of grandchildren. This prevents infinitely deep research chains.
Credit budget
Separate from the node budget, the credit budget tracks what the run is actually spending. If it runs low, nodes receive a signal to be more conservative — favouring concise analysis over exhaustive.
Everything LumaVista charges for is denominated in credits, never in currency. See How Credits Work.
Extending the budget
If a project hits its budget limits but you want deeper research, LumaVista will ask you through the Human-in-the-Loop system. You can approve additional budget, increase the depth limit, or decline and let the project finish with what it has.
Reading the graph visualization
The graph view in the project interface shows nodes connected by edges:
Node states
- Queued — The node is waiting to run. It appears as a neutral-toned node.
- Running — Actively working. Indicated by an animated border.
- Completed — Finished successfully.
- Failed — Something went wrong. Click the node to see error details.
- Needs expansion — The node’s output triggered a request for further investigation. Pending your approval if HITL is active.
- Pending children — The node is waiting for its children to complete before it can be finalized.
Node details
Click any node to see its details panel:
- Input — What it was asked to do.
- Output — What it produced (search results, analysis, synthesized content).
- Node type — Which of the nine kinds this is.
- Credits — What this node spent.
- Timing — When the node started, how long it ran, and when it completed.
- Depth — How deep in the graph this node sits.
Graph layout
The graph flows top-to-bottom, with the root planner at the top and leaf nodes (searchers, reasoners) at the bottom. Edges show parent-child relationships. You can zoom and pan to navigate larger graphs. On mobile, use pinch-to-zoom and touch panning.
Post-execution expansion
Not all expansion comes from the planner. Sometimes a search node turns up something nobody planned for — a contradiction between sources, a gap, a new angle. When that happens it can request post-execution expansion.
The system detects expansion triggers in two ways:
- Explicit requests — the node’s output says further investigation is needed.
- Signal detection — the system scans the output for phrases suggesting deeper exploration is warranted, like “requires further investigation”.
When a trigger is detected, the node transitions to a “needs expansion” state. If you have Human-in-the-Loop enabled, you will be asked to approve the expansion. If approved, a new planner is invoked to break the subtopic into further subtasks, and the graph grows from that point.
This is how LumaVista handles the unexpected — the research can adapt to what it finds, rather than being locked into the plan that was made before any searching happened.
Common graph patterns
After running a few projects, you will start recognizing patterns:
Wide and shallow — The planner creates many subtasks at depth 1, but few go deeper. This is typical for survey-style research (“give me an overview of X”) or when the budget is moderate.
Narrow and deep — The planner creates fewer subtasks, but they expand into deeper investigation. This happens with focused questions on a thorough strategy.
Asymmetric — Some branches go deeper than others. This is the most common pattern for complex questions — some subtopics warrant more investigation than others, and the budget system allocates accordingly.
Related docs
- Guiding Your Research: Human-in-the-Loop — How to approve, reject, or batch-manage expansion requests
- Chatting With Your Research — Ask follow-up questions about your research findings